← Administered Empire and Victorian Atlas
 Click to enlarge
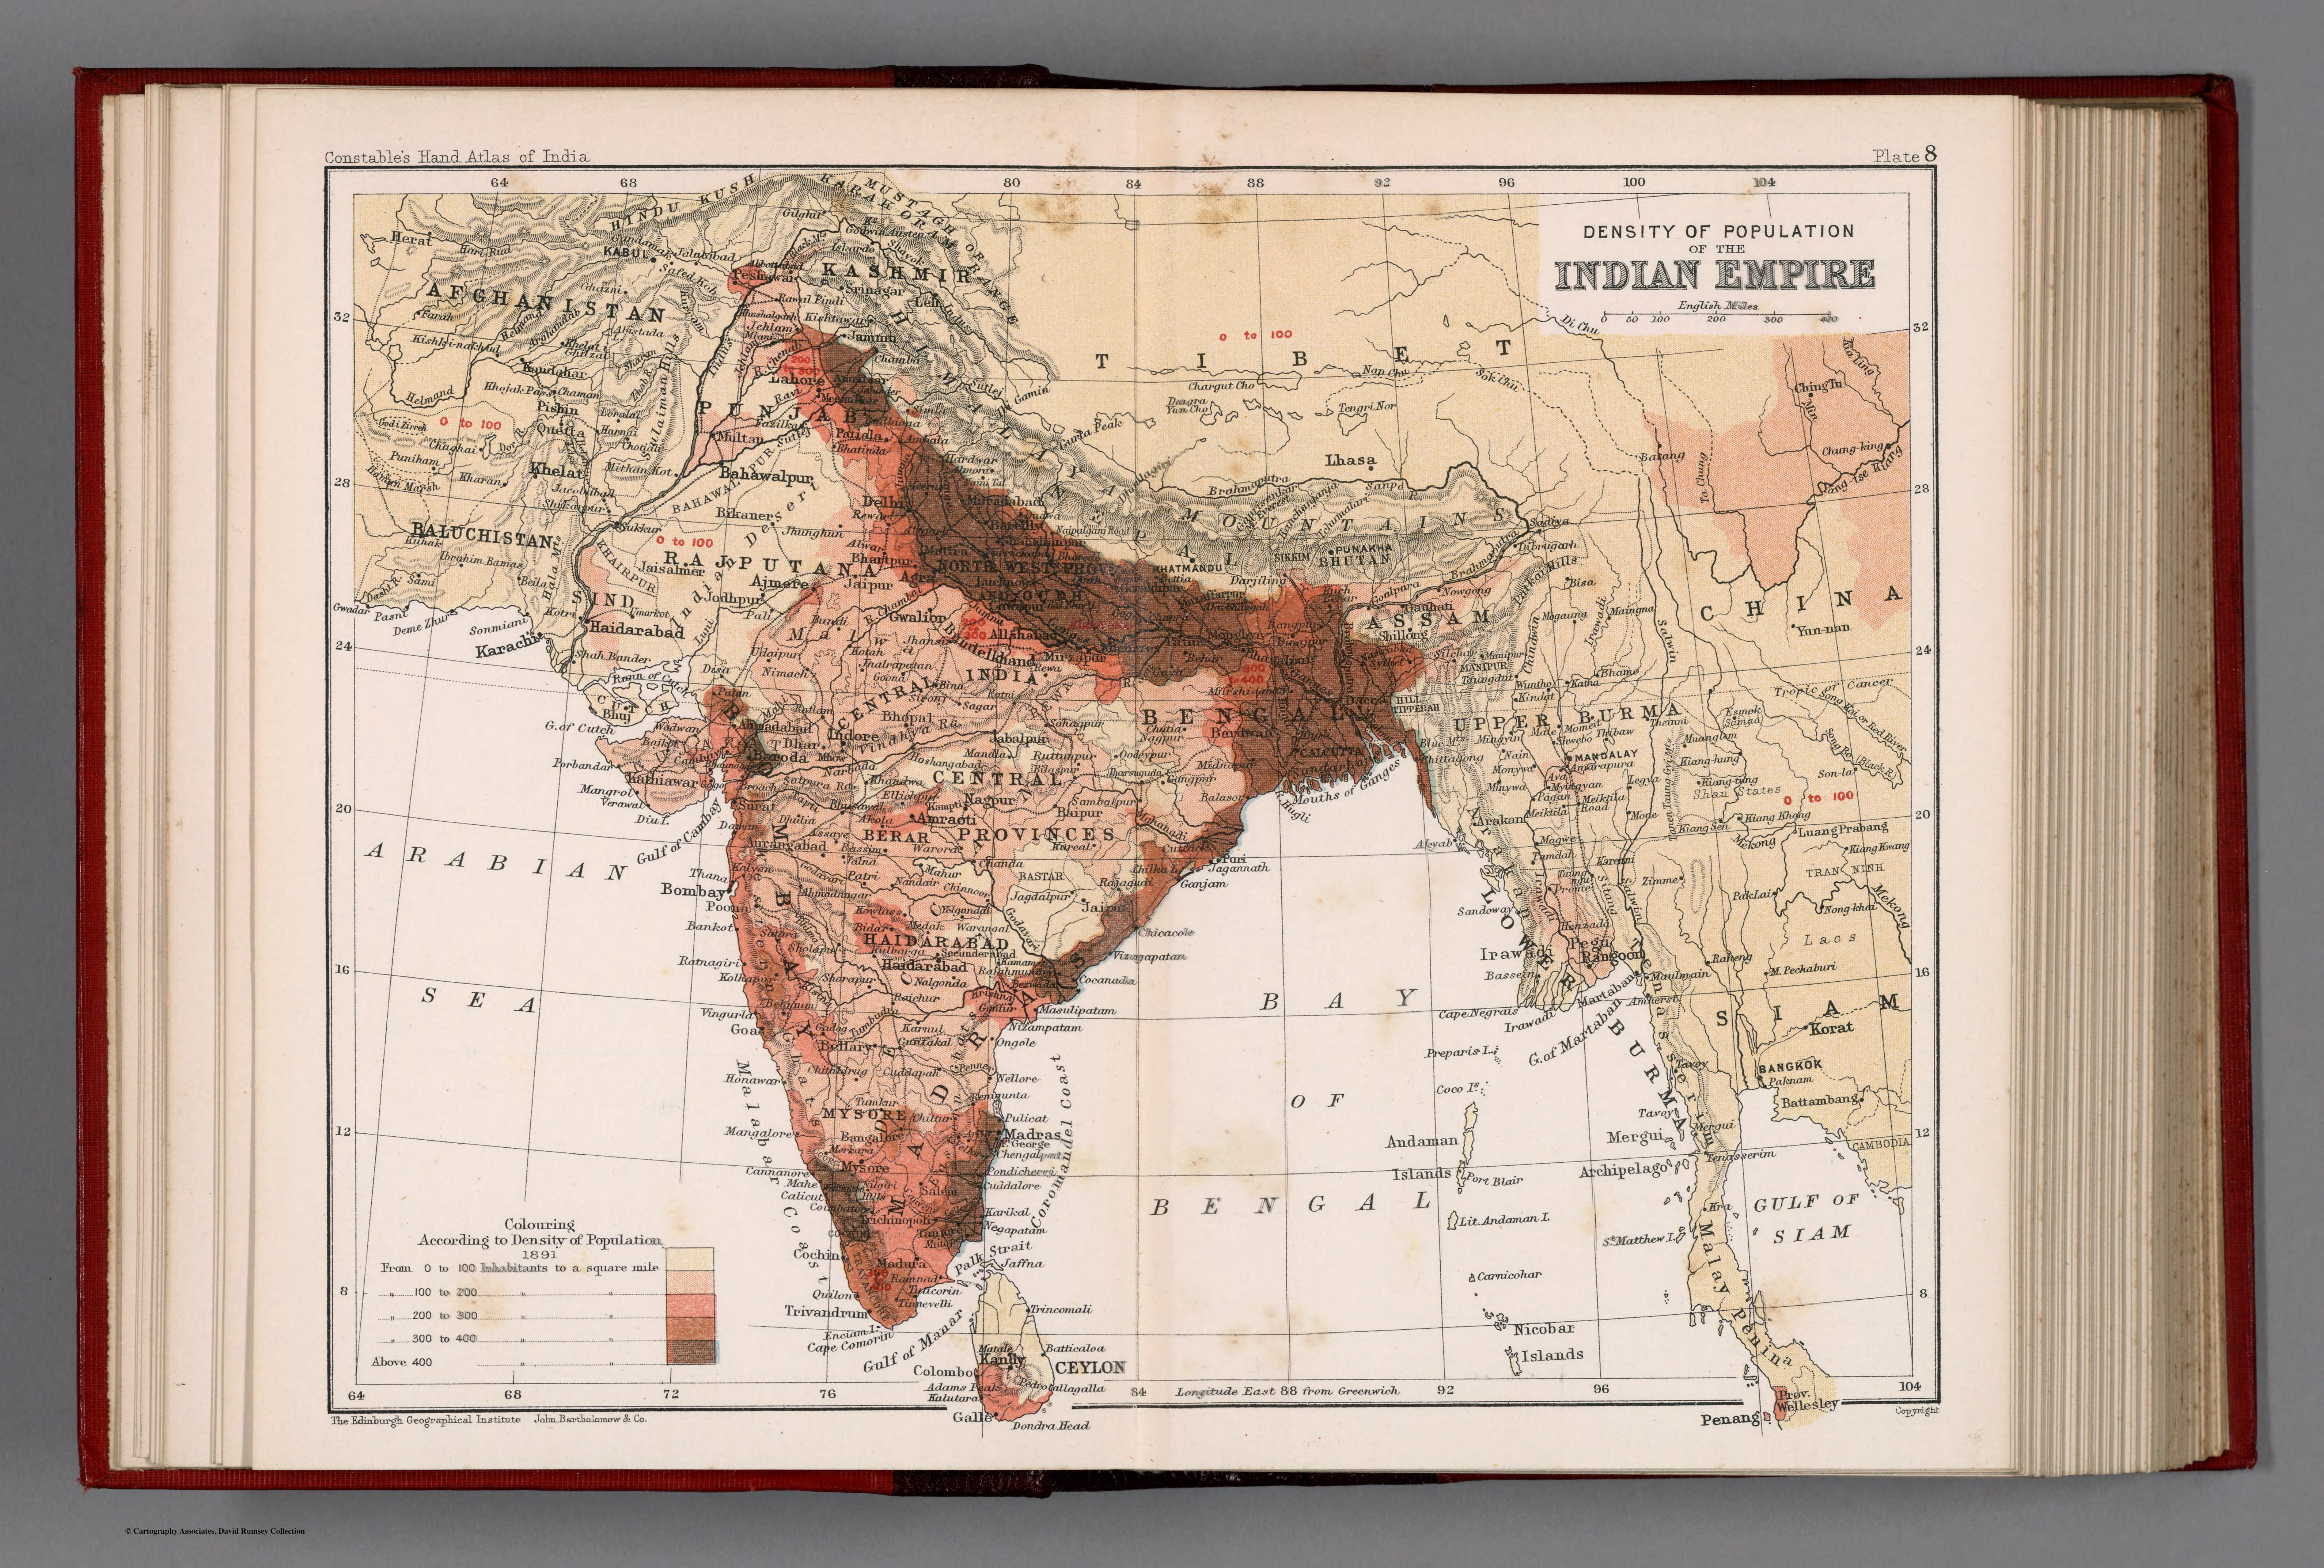
Density of population of the Indian Empire. Plate 8
A thematic map of the density of population of the Indian Empire, from Constable's Hand Atlas of India — the subcontinent rendered as a single statistical surface. India as demographic data.
Authorship and object
Plate 8 of Constable's Hand Atlas of India (Bartholomew / Edinburgh Geographical Institute, 1893), at about 1:20,000,000, with administrative divisions, major cities and a colour-coded key to population density; prime meridian Greenwich.
Mapping by statistic
This is a choropleth — colour standing for a quantity, here people per unit area, drawn from the imperial census. The land is shown not by its terrain or its history but by a single measured variable spread across it.
The gaze
The thematic map is the administrative gaze made visual. To shade India by population density is to treat the subcontinent as a body of data to be counted and managed — its hundreds of millions abstracted into a graded wash of colour. This is empire as statistics, the census turned into a picture.